
Community Mapping Workshop a Success!

March 31 2024
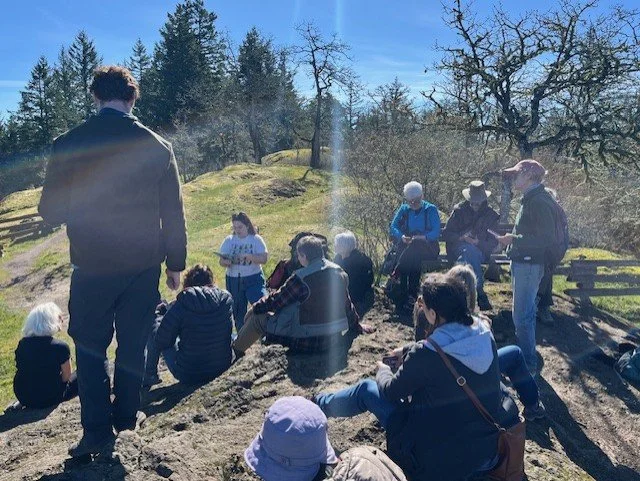
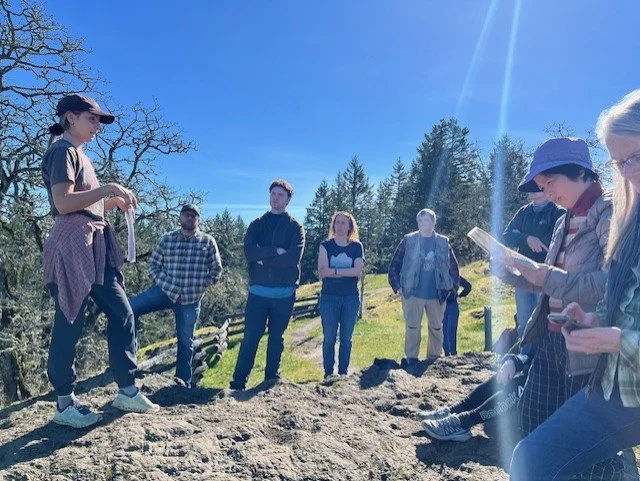
We had an amazing Community Mapping Workshop with 19 participants on March 16 2024. We are grateful for our funders who made this event possible including: Habitat Conservation Trust Foundation, Victoria Foundation, Metchosin Foundation, the Government of Canada – Environmental and Climate Change Canada Priority Places Fund, the Province of British Columbia, Clean Foundation, and many others, as well as private donations from individuals like you.
This workshop was organized by our Stewardship Team - Emily Buccioni and Julianna Laposa-Wilde featuring support from our Protected Lands Manager Nina Levin.
Here is the Mapping Workshop content we shared to our participants:
Living Land Acknowledgement
This workshop is taking place on unceded W̱SÁNEĆ territory
In SENĆOŦEN this place is not far from SṈIDȻEȽ and so could be called SṈIDȻEȽ ŦIŦEȽ SṈÁNET hill/mountain above “place of the blue grouse”, an important place for medicinal plants. J,SIṈTEN (John Elliott, Tsartlip elder) tells us the story of how SṈIDȻEȽ was actually the first W̱SÁNEĆ village site (info from PEPAKEṈ HÁUTW̱)
SṈIDȻEȽ today is also referred to as Gowlland Tod Provincial Park
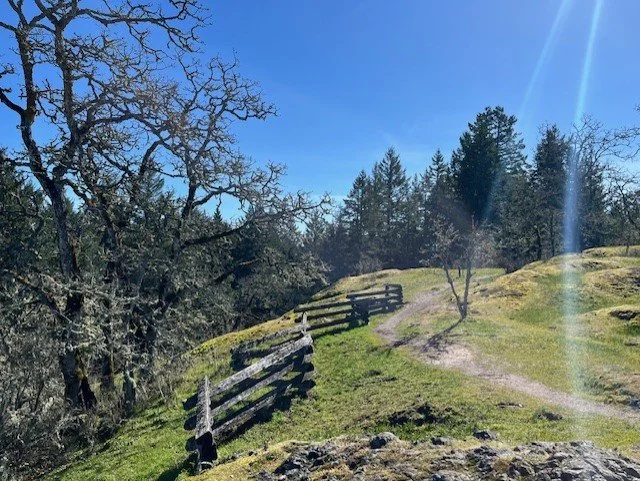
Oak Haven Park is just over 25 acres of Garry oak meadows and rocky outcrop areas
Garry oak ecosystems/camas meadows are culturally significant ecosystems that are rapidly disappearing throughout this area, so they are incredibly important to protect and steward when we can
HAT has a covenant on the park land, so this area is safe from development, but is still facing threats like invasive species and trampling
There is a stewardship group that meets here on the last Sunday of every month from 10-1 to steward the park
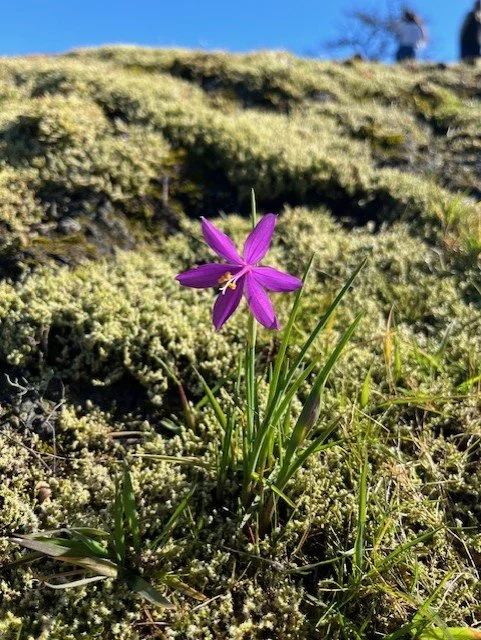
We’ll be mindful as we move through this area of all the plants that are growing and blooming at this time of year – stay on designated trails and watch your step!
Introduction and Reporting with Emily Buccioni
Why map?
Mapping can be a great tool, whether you're involved in community restoration work, or just wanting to learn more about your own property. If you’re working to steward an area, it can be extremely helpful to know what’s already there. We recommend taking an inventory of species before starting a restoration project to help with your planning. When you’re working on a larger project, breaking the project down into different sections will help make it more manageable and less overwhelming. You can use mapping to plan restoration areas, identify invasive species and species at risk, and share information about your project with others.
Before we get into using the mapping software, we’re going to talk about some common apps that many of you have probably used in the past. They’re easy to use, and will help you with your species identification.
Importance of Community or Citizen Science:
When you submit your findings to seek and iNaturalist, you’re participating in community science. Community science generates incredibly important data – in this case, biodiversity data. Researchers/scientists can’t collect all this data on their own. It’s particularly useful to document the presence of threatened species, and new invasive species populations, but any data you can collect on iNat is useful! When you use iNat, you’re not just marking the presence of where certain species are, but also when they occur. Having this data can let scientists know if there are changes in patterns over time. For example, if a plant species usually blooms in May, but is beginning to bloom earlier in the year, or animals being spotted when they would normally be in hibernation.
Apps for Species Identification
Merlin: Merlin is a great ID app for birds. You can submit photos, do step-by-step ID, or use the sound ID function. If you’ve never used the app before, you’ll need to first download the US and Canada: continental or the Canada West bird pack. You can browse through the common birds in the area, and listen to their calls. Merlin will also show you range maps when you click on a species, and will tell you if the bird is uncommon. Once you see a bird, you can add it to your life list!
Seek: Seek is for all species, and it’s quite easy to use. You can use the camera in the app or upload a photo from your camera roll. Once your observe a species, you can save it to your observations and go back to it later. You can also click on a species to view information, including taxonomy, seasonality, range map, and similar species to explore. One great feature is that it will tell you if the species is native or introduced, and even if it’s a threatened species.
iNaturalist: iNat is an app used to map individual species observations and connect with a community of other people who are doing the same. Seek uses AI to identify species, whereas iNat relies on verification from others. When others verify your photo, your ID becomes “research grade” and is contributing to community science. You can view a map or list of species others have seen near you, and you can join specific projects or bio-blitzes. Where Seek stores your observations on your own account only, iNat connects them with a network of others worldwide.
Reporting Invasive Species
After using species identification apps like iNat, Seek, and Merlin, you can use mapping at home to report and map species or explore other species around you! There are a few ways to do that such as reporting invasive species through (IAS) ,CRD regional map, and CDC iMap/BC ecosystems explorer.
Some of the next examples are good introductions to applications of mapping and how community science can be used to pull data and observations from apps like iNat to get a more holistic view of species composition and critical habitat and inform regional/provincial conservation planning and priority places.
Report Invasive Species BC app (IAS) – Invasive species reporting through the app, hotline, online form, or email address. Reports are reviewed by experts who map occurrences, and coordinate follow-up activities as needed. Reporting invasives helps decision makers identify new occurrences of introduced species, prioritize areas to treat for invasives. In many cases, reported sightings can uncover new priority areas or identify small populations of invasives to control before they spread. Information needed for reporting is latitude/longitude coordinates/address, address, photos, and detailed description.
Invasive species council of BC
Coastal Invasive Species Committee
BC Provincial Government Page
Exploring Publicly Available Data
CRD Regional Map – Is good for exploring and learning about areas and ecosystems. Open the “I want to” function, and it allows for exploration of available maps in the area. These include basemaps with satellite imagery, watersheds/water courses, contours, trails, regional planning, regional parks and trail maps, (environment/natural areas) sensitive habitat inventory mapping, fish presence, terrestrial species, land cover analysis, and administrative features. This also allows you to search for addresses and property IDs to learn details about your property/identify natural features or another property in question. You can also use this tool to find data in a specific area by dragging and drawing a rectangle. This can also be useful for finding data on the map and creating buffers
CDC iMap – Maps locations of species and ecosystems for, with a focus on Red and Blue listed species and ecosystems (element occurrences/EOs). This utilizes a network of scientists to improve consistency and accuracy of data, using standardized protocols/guidelines for collection and management of data and management of EOs representation on maps. Locations are defined as EOs and have practical conservation value and EO records are compiled to contribute to the wide range picture of conservation status that can inform regional and provincial conservation planning
The value is identifying where species and communities exist, and the viability of their populations is essential for assessing risk of extirpation or extinction and informs planning/conservation actions. The public have access to view known locations, download known locations, and view potential locations.
How-to Points, Polygons, and Photopoint Monitoring with Nina Levin
Another way that you can apply mapping to your projects (both personal and community-based) is by mapping points and polygons.
Points: You can use points to map the presence of invasive species or species at risk, or mark important locations (ex. Wildlife habitat). You can mark points along a path to help you get back to the same location. When you have point data, you can use a GPS to return to the points. Using iNat is kind of like mapping point data – marking the place where you saw a particular species.
Polygons: Polygons are useful to create when working on larger projects. You can map polygons to break your project area into smaller sections (“management sections”). This can help you create a management plan for your property/project area and make the project seem less overwhelming. You may choose to work on one management area at a time, or use polygon mapping to determine the areas of highest priority. You can name your polygons or label them as different management areas.
When creating polygons to map project areas, you may choose to separate areas based on the natural features that are there. For example, you may create a polygon for a rocky outcrop, and a separate polygon for a wetland area.
Polygons can also be useful to help you track changes in a site over time. For example, you might create a polygon to map a population of Scotch broom, and go back to map the population every year/every few years. This way, you’ll be able to tell if the species is spreading and how quickly, or you might be able to see the results of your hard work if the population is shrinking!
Photo monitoring: photo monitoring (also called photo point monitoring) is easy and inexpensive way to monitor a site. You can use whatever kind of camera you have – even a good quality phone camera is fine. As with any kind of mapping, it’s important to determine your objective, or the reason why you want to do this. It could be to see a change in an area with land development, an increase of invasive species, or monitor for the effectiveness of management.
When doing photo monitoring, it’s important to mark photo points (points you want to include in the photo) and camera points (places from which the photos are taken) so that you are eliminating other factors from impacting the effectiveness of monitoring. You’re trying to take photos that are as similar as possible to be able to see the changes in a space over time. Often, will need a compass/compass app to take a photo at 0, 90, 180, and 270 degrees for photo uniformity.
Figure out how often you want to return to the site to monitor. Ideally, this should be done at regular intervals (the same amount of time between each photo). Make sure you choose a realistic goal, and that enough time is passing between each photo to really see a change. For a restoration site, you likely wouldn’t want to monitor every day. If you’re part of a stewardship group working on the same area each week, you could monitor weekly. If it’s a site you don’t visit often, you can monitor every 2 or 6 months, or even once per year. Depending on your goals, it might be interesting to document the site in different seasons.
Wildlife Mapping with Julianna Laposa-Wilde
Applications of mapping applied to wildlife habitat in Oak and Prairie ecosystems:
Oak and Prairie ecosystems provide important habitat to a large diversity of plants and animals and are home to over 100 species at risk. Some Oak and prairie habitat features include wildlife trees, which are home to birds, bats, invertebrates, fungi and more, rock piles, leaves, and wood debris provide homes for snakes and slugs.
You can use iNaturalist to identify these species. Documenting these habitat features on iNat is important for citizen science. For example, seeing bats in the winter is rare because they should be in hibernation so reporting bats will help biologists to monitor change in behavior. You can report species at risk to the CDC, and you can use Gaia to map the habitat structures.
There are also features used for habitat enhancement, such as bat houses, artificial cover objects for monitoring slugs and snakes, and bird boxes. You may have some of these features on your property! Why would you be interested in mapping these habitat features? You may be interested in mapping potential habitat for your own knowledge, reporting species, monitoring sites for species at risk, features for restoration, or knowledge for future landowners.
Wildlife trees play an essential role in forest ecosystems. They provide food, cover, nesting, and perching sites. Dead trees are critical for forest ecosystems by providing habitat for various nesting birds, bats, invertebrates, and fungi, to name a few. The Great horned owl uses tree deformities for nesting sites such as the one seen here in this beautiful wildlife tree! The Western screech owl, a local owl once abundant in Victoria, uses cavities in wildlife trees made by woodpeckers. Their population has declined by 90% in the last 20 years. Bats will use many wildlife tree features, including cavities and flaking bark.
Mapping potential habitat for species at risk is useful so you can report the location to protect them and their habitat in the future. For example, without habitat mapping a forest and an open field may be viewed as equivalent open spaces. However, forests and fields can have dramatically different ecological features and can host varying habitats. If there was a development happening and there was a species at risk, having documented reports could prevent the development from going ahead.
Sharp tailed snakes are the smallest and most secretive snake on Vancouver Island. They are endangered due to their limited range and low population size. Sharp-tailed snakes rely on Oak and prairie ecosystems and are found in open, rocky, sunny bluffs. Blue-grey taildroppers are a tiny blue endangered slug. They are a native species that can drop their tails if frightened and is a very rare sight to see! Tail droppers are found in oak and prairie meadows and Douglas fir forests. BGT’s main food source is mycorrhizal fungi. They spread these spores which help plants and trees capture nutrients from the soil, essential for a healthy forest.
You can map the areas where you find these species and report them to the CDC. HAT works to identify and protect habitat where these species are found. We use artificial cover objects to monitor the sharp-tailed snake and blue grey taildropper. The cover objects are squares of roofing shingles for snakes and layered cardboard for slugs. During monitoring seasons the ACO’s are checked periodically for the presence of these species. We place the ACO’s on the ground in suitable habitat areas – they can be hard to find amongst vegetation! Mapping monitoring sites for species at risk might be useful to you if you have a large property and you are worried about not being able to find the location. When it's time to monitor the species at risk, your monitoring sites will be easy to find!
Thank you to everyone who attended!